Naspers Is Not a Reliable Rand Hedge
In the 62 worst weeks for the rand since 2015, Naspers rose in 31. Eleven years of weekly prices on the JSE's most quoted rand hedge, and why the currency gain keeps getting cancelled.
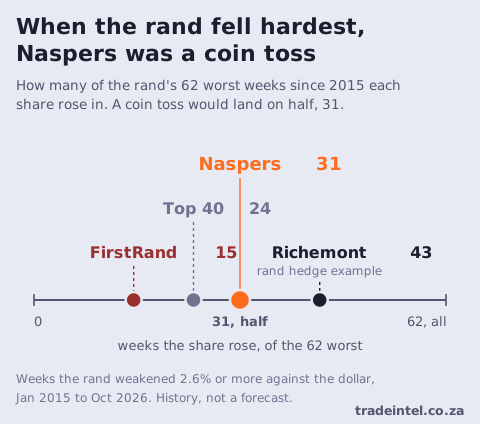
Since January 2015 the rand has had 62 weeks in which it lost 2.6% or more against the dollar, 4.2% on average. Naspers is the JSE share most often described as a rand hedge. It rose in 31 of those weeks and fell in the other 31, and its average move across all 62 was a fall of 0.3%.
That is a coin toss. Naspers rises in 52% of all weeks, so a bad week for the rand leaves its odds about where they started. It did lose less than the Top 40, which fell 1.0% on average in those weeks. Richemont, which we use as the example of a true rand hedge because its business sits almost entirely outside South Africa, rose in 43 of the 62.
Everything below is a historical association in public price data, not a forecast.
Why is Naspers called a rand hedge?
A rand hedge is a share whose rand price tends to rise when the rand weakens, because what the company owns or earns is priced in another currency. There are two ways to be one. A company can own foreign assets, so a weaker rand turns the same assets into more rand. Or it can earn in dollars and pay its costs in rand, so a weaker rand widens its margins. Gold miners and Sasol are the usual examples of the second kind.
Naspers is the first kind. Most of its value is a stake in Tencent, the Chinese technology group, held through Prosus and priced in Hong Kong dollars. When the rand weakens, each Hong Kong dollar of Tencent is worth more rand, so on paper Naspers goes up. Its South African businesses, Takealot and Media24 among them, earn in rand and are too small to change that.
Half of the case is true
We measured how much Naspers moves for a given move in the rand, week by week, with Tencent's own share price held constant. The currency gain is real: about 3.3% for every 10% the rand weakens.
"Real" has a test behind it. Every estimate in this piece comes with a t statistic, which is the estimate divided by its own margin of error (that margin grows when the weekly prices are noisy). When the t statistic is beyond 2 in either direction, the result is more than luck or pure chance, and we call it significant. Below 2, the link could be chance. The currency gain passes easily.
One more piece of method. The weeks the rand weakens are usually weeks when global markets fall too, so a straight comparison mixes up two things: the rand's move and the general mood. To separate them, we also measure what the S&P 500 did each week and take out the part of each share's move that global markets explain. What is left is the rand's own effect. Wherever this article says "after allowing for global markets", that is the adjustment.
Tencent's price is the part that does not hold constant. In the weeks the rand weakens, Tencent tends to fall, about 5.0% for every 10% weaker rand after allowing for global markets, and that fall is significant too. About 82% of a move in Tencent carries through to Naspers, so Tencent's fall costs a Naspers holder about 4.1%. That is more than the currency adds.
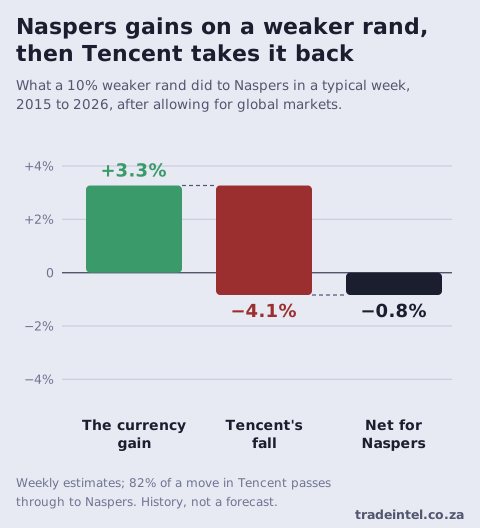
Put the halves together and you get two numbers, one with the adjustment and one without. Without it, which is what a holder actually saw, Naspers fell 3.2% for every 10% the rand weakened, and that fall is significant. With it, the fall shrinks to 0.8%, which could be chance. The gap between the two is the global slump that tends to arrive with a weak rand: most of the fall Naspers holders saw came from that, not from the rand itself. Neither number shows the gain a hedge is supposed to deliver.
Prosus gives the same answer. Using it in place of Tencent, from its listing in September 2019, Naspers lost a significant 3.3% per 10% weaker rand on top of the currency gain.
Why do Naspers and the rand fall together?
The rand and Tencent sit in the same line of fire. When global investors turn cautious, emerging markets are usually among the first places they pull money from, and both the rand and Chinese technology shares are emerging market assets that foreigners hold in size. In the rand's 62 worst weeks, the iShares MSCI Emerging Markets fund (priced in dollars) fell in 53, and Tencent fell in 43 in its own Hong Kong price. The weak rand and the falling Tencent price are two results of the same thing, money leaving emerging markets.
A gold miner gains twice from a weaker rand, because its dollar revenue is worth more while its rand costs stay put. Naspers gets the translation and nothing else, so it has nothing extra to set against Tencent's fall.
China also matters more to Naspers than the rand does. Its biggest moves have come from Beijing: the 2021 regulatory crackdown, the October 2022 party congress, the gaming rules of December 2023. The rand and the US market together explain only about 7% of the week-to-week variation in Naspers.
Naspers is also about 7% of the Top 40, so index funds and foreign investors hold it in size. When they cut their South African holdings, which tends to be when the rand weakens, Naspers goes out with everything else.
It makes no difference why the rand weakened. We split each week's move into the rand against the euro (closer to South African news) and the dollar against the euro (closer to global dollar strength). Naspers lost ground in both cases, significantly so when the rand weakened against the euro.
The last two years
An eleven-year average can hide a change. So we ran the same measurement over every two-year window, a week at a time, from the window ending December 2016 to the one ending 16 October 2026.
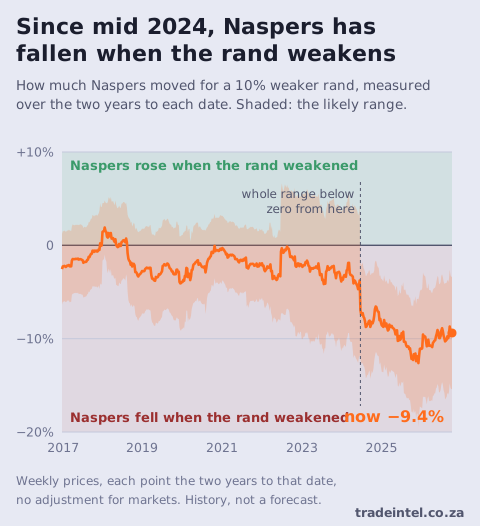
None of the 512 windows shows Naspers working as a hedge. Since mid 2024 every window shows it falling when the rand weakened, with the whole likely range below zero. Over the two years to 16 October 2026 it fell 9.4% for every 10% weaker rand.
After allowing for global markets there is one exception, a run of windows covering the March 2020 crash. In 2020 the rand weakened sharply and stayed weak for months, while Tencent recovered from its March fall and stood about 40% above its January high by July, so the currency gain came through. Since mid 2022 that reading has stayed below zero too.
Over a quarter, part of the gain comes back
Over longer stretches the picture is kinder to Naspers, but not by enough to rely on. Once the first rush passes, some of the currency gain does come through, and in the rand's worst quarters Naspers held up better than the Top 40 on average. It still fell in many of those quarters, and the result changes with the exact weeks you count from. A hedge that works only if you pick the right start date is not one we would call reliable.
The same test on five JSE shares
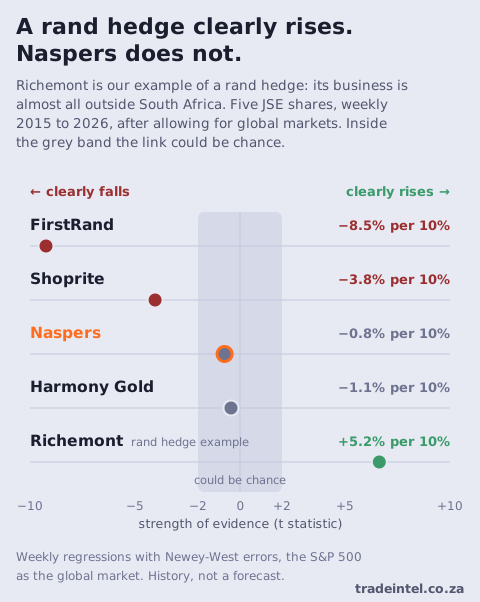
FirstRand and Shoprite earn in rand and clearly fall with it, as a South African bank and a South African retailer would. We use Richemont as our example of what a rand hedge looks like because it ticks every box. It owns Cartier and Van Cleef & Arpels, reports in euros, and sells almost entirely outside South Africa, so a weaker rand turns the whole business into more rand. The data backs that up: it clearly rises when the rand weakens. Its Swiss share price dips a little in those weeks, but far less than Tencent's does, so most of the currency gain survives. It is not the only rand hedge on the JSE, just the clearest example among the five we track. Harmony is a dollar and gold story more than a rand one. Naspers sits with Harmony, inside the band where the link could be chance.
How we measured it
- Prices are daily closes from public sources, turned into Friday-to-Friday returns from January 2015 to 16 October 2026 (615 weeks), with the rand measured against the dollar. Richemont's JSE line has clean history from April 2023. Before that we use its Swiss price converted to rand, which the JSE line tracks.
- We work with weekly returns, not price levels. Two price charts that both drift up over ten years look related whether they are or not.
- Most weak rand weeks are bad weeks for global markets, so we allow for what the S&P 500 did each week to separate the rand from the general mood. The Top 40 would be the obvious alternative, but Naspers is part of it. Against the Top 40 with Naspers taken out, there is no significant link either way.
- The daily dollar and rand price is stamped at the start of each day, before the JSE trades, so each JSE close is paired with the next day's stamp.
- Margins of error use Newey-West standard errors, which allow for patterns that carry over from one week to the next.
What this does not tell you
It does not say Naspers is a bad share, or what it will do next. It says that over these eleven years, in the weeks the rand weakened most, Naspers did not reliably go up.
The sample starts in 2015. The rand hedge label is older than that, and we have not tested the years before.
A hedge earns its place when the rand falls hard. In the sharpest falls of the last eleven years, Naspers lost a little less than the Top 40 and rose about as often as in any other week. Richemont, with its business almost entirely abroad, rose in two weeks out of three.
The rand reading for Naspers is on its share page, with a free account.
TradeIntel publishes general information, not financial advice. It is not a registered financial services provider. Every figure above is a historical association in public price data, the same for every reader, and not a forecast.