One Screen, Two Markets
Point the same filter at the JSE and the S&P 500 and it returns almost unrelated lists. That is not a bug. It is the most important thing a screener can teach you.
Why does one screen return different stocks on the JSE and the S&P 500?
Run a valuation screen on the JSE Top 100 and again on the S&P 500 with an identical absolute cutoff, say a price-to-earnings ratio below twelve, and something strange happens. The JSE returns a long list. The US returns almost nothing. Same filter, same number, wildly different output. It is tempting to conclude the JSE is a bargain bin and the US is uniformly overpriced.
That conclusion is mostly an illusion, and unpacking it is the most useful thing a screener can teach you. The two markets are not the same universe with different prices. They are different universes, with different median valuations, different sector mixes, different currencies, and different risks baked into every number. A filter that ignores those differences is not being objective. It is quietly importing the assumptions of whichever market it was designed for.
This is why the TradeIntel screener calibrates its thresholds per market. Not to be lenient with one and strict with the other, but because "cheap" is a statement about a distribution, and the JSE and the S&P are two different distributions.
What does "cheap" actually mean in a stock screen?
Start with the fact underneath the whole thing. The US large-cap universe trades at a substantially higher median valuation than the JSE. There are real reasons, a deeper and more liquid market, a heavier weighting toward high-growth technology, a home-currency premium, but the reason matters less than the consequence: the middle of the US distribution sits to the right of the middle of the JSE distribution.
Now drop a single fixed cutoff on both. A P/E-below-twelve line that lands near the JSE's median, catching a healthy slice of the market, lands far out in the left tail of the US distribution, catching almost nothing. The line did not measure cheapness. It measured how far each market's typical stock sits from an arbitrary number.
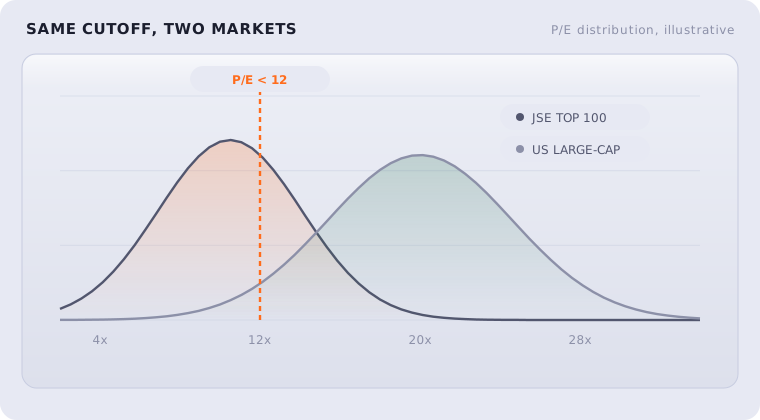
The fix is to define cheap where it means something: relative to the market the stock actually trades in. A stock in the cheapest quartile of the JSE and a stock in the cheapest quartile of the S&P are both genuinely cheap for their world, even if their raw multiples are miles apart. Calibrating per market is not softening the test. It is the only way the test asks the same question in two places.
How else do the JSE and the S&P 500 differ?
Valuation is the clearest example, but the same logic runs through every filter, because the difference runs deeper than price. The two markets are built differently.
Sector mix changes what a filter catches. The JSE leans toward resources, financials, and a handful of global-facing industrials; the S&P leans heavily toward technology and healthcare. A profitability or cash-flow filter will therefore surface different kinds of business in each, not because the filter is biased, but because the raw material is different. A cash-flow screen on the JSE is fishing in a pond full of miners and banks; the same screen on the S&P is fishing among software companies.
The dividend bar has to move. A ten-year unbroken dividend streak is a demanding, high-information bar on the JSE. On the S&P 500 it is so common it tells you almost nothing, which is why a serious dividend filter holds US names to a far longer standard. The same "reliability" test needs a different threshold to carry the same meaning.
Currency and cycle sit inside every number. A JSE earnings figure lives in rand, exposed to a different inflation and rate cycle than a dollar-denominated one. Comparing the two at face value quietly compares two economies as much as two companies.
Why calibrate screen thresholds per market?
It would be simpler to run one global cutoff and call it objective. It would also be wrong, and quietly so, in a way that is hard to notice because the output still looks like a clean list.
A single absolute threshold does not remove judgement from screening. It hides a judgement inside a number: whichever market's norms the threshold happens to match becomes the invisible standard, and every other market is measured against a yardstick built somewhere else. The screen looks neutral and is anything but.
Per-market calibration drags that hidden assumption into the open and makes it explicit. It says: cheap means cheap here, reliable means reliable here, and a JSE result and a US result are each answering the same question about their own market rather than being forced through one market's ruler. That is what lets you actually compare the two, once you understand that you are comparing two percentiles, not two prices.
What should you take from two different lists?
The two lists were never supposed to match. When the same filter returns different companies on the JSE and the S&P, it is not disagreeing with itself, it is telling you the truth about two different markets, each measured on its own terms.
The habit worth taking from this is suspicion of any number that claims to travel unchanged between very different markets. A ratio or a cutoff carries the assumptions of the place it came from. A good screen calibrates, says so, and then leaves you the one job no screen can do: deciding what two answers, each true in its own market, mean when you put them side by side.