Best Dividend Shares in South Africa: 28 JSE Names With the Longest Streaks
Twenty-eight JSE companies have paid a dividend every year for at least a decade without ever halving it. The full list, with yields and what each one paid through 2020.
On 9 September 2026 our screener checked all 113 companies in the JSE universe against one rule: has this company paid a dividend every year for at least ten years, without ever cutting it by more than half?
Twenty-eight passed, a quarter of the names we cover. Here they are, with what each one did to its dividend in 2020.
What is a dividend king, and does the term work in South Africa?
The phrase comes from the United States, where a Dividend King is a company that has raised its dividend every year for at least fifty years. There are 57 of them as of 2026. The Dividend Aristocrats are a softer version: twenty-five years of increases, and you have to be in the S&P 500.
Both definitions turn on an increase every single year, and no JSE company would qualify under either. Of the 28 on this page, one has never reduced its dividend in any year we hold data for, and that is PSG Financial Services with twelve years of history behind it.
That says more about how South African dividends are set than about the companies paying them. Most JSE boards declare a payout as a proportion of what the company earned that period, so the dividend moves with earnings by design. A progressive dividend, held up through the bad years and raised in every good one, is a far less common policy here than in the United States.
Our rule tests something a JSE company can actually do. It qualifies if it has paid something every year for ten years or more and has never cut the payment by more than half from one year to the next.
Which JSE shares have the longest dividend streaks?
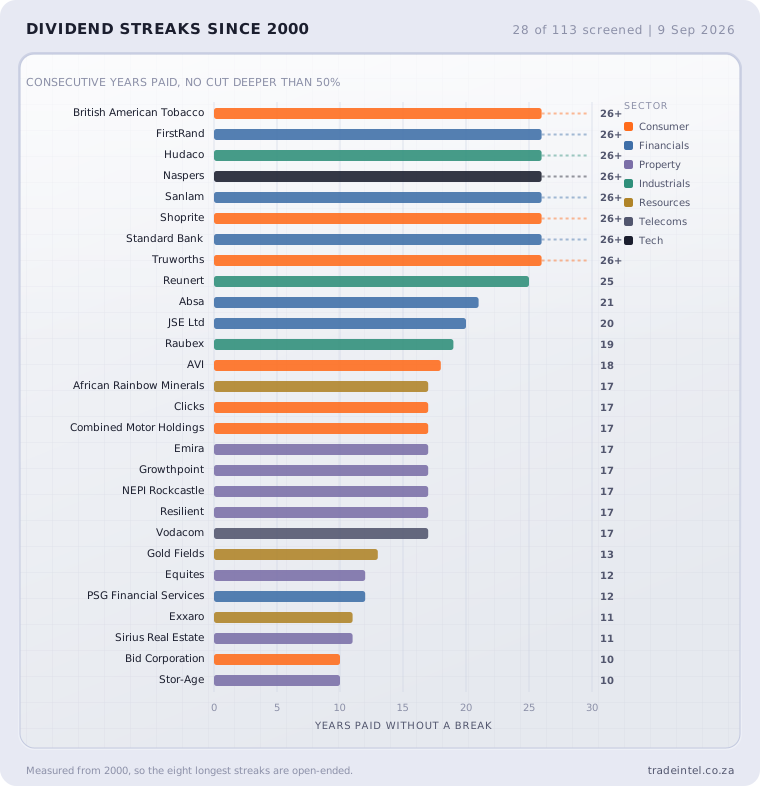
Twenty-eight names, ordered by streak length. Yield, P/E and free cash flow yield are on the 9 September 2026 close. A streak marked 26+ is one our data cannot see the start of, for the reason set out further down.
| Years | Share | Sector | Yield | P/E | FCF yield |
|---|---|---|---|---|---|
| 26+ | British American Tobacco (BTI) | Consumer | 6.0% | 13.8 | 6.5% |
| 26+ | FirstRand (FSR) | Financials | 5.3% | 12.2 | 0.1% |
| 26+ | Hudaco Industries (HDC) | Industrials | 6.2% | 9.6 | 20.1% |
| 26+ | Naspers (NPN) | Tech and media | 0.7% | 7.4 | 4.1% |
| 26+ | Standard Bank (SBK) | Financials | 5.5% | 9.9 | 7.3% |
| 26+ | Shoprite (SHP) | Consumer | 2.8% | 21.0 | 5.4% |
| 26+ | Sanlam (SLM) | Financials | 5.6% | 11.3 | 0.9% |
| 26+ | Truworths (TRU) | Consumer | 10.3% | 6.4 | 10.1% |
| 25 | Reunert (RLO) | Industrials | 7.0% | 9.6 | 5.3% |
| 21 | Absa (ABG) | Financials | 7.3% | 8.2 | 22.5% |
| 20 | JSE Ltd (JSE) | Financials | 6.2% | 10.9 | 8.5% |
| 19 | Raubex (RBX) | Industrials | 5.9% | 6.9 | 0.0% |
| 18 | AVI (AVI) | Consumer | 9.6% | 11.0 | 10.3% |
| 17 | African Rainbow Minerals (ARI) | Resources | 7.3% | 9.3 | 9.1% |
| 17 | Clicks (CLS) | Consumer | 4.6% | 13.5 | 4.8% |
| 17 | Combined Motor Holdings (CMH) | Consumer | 6.0% | 7.0 | 33.8% |
| 17 | Emira Property Fund (EMI) | Property | 9.5% | 8.9 | -7.2% |
| 17 | Growthpoint (GRT) | Property | 8.1% | 10.6 | 0.8% |
| 17 | NEPI Rockcastle (NRP) | Property | 7.2% | 10.6 | 4.6% |
| 17 | Resilient REIT (RES) | Property | 7.2% | 5.2 | -0.4% |
| 17 | Vodacom (VOD) | Telecoms | 5.3% | 14.8 | 11.0% |
| 13 | Gold Fields (GFI) | Resources | 4.2% | 9.4 | 5.8% |
| 12 | Equites Property Fund (EQU) | Property | 8.2% | 9.9 | -1.8% |
| 12 | PSG Financial Services (KST) | Financials | 2.0% | 23.8 | 3.0% |
| 11 | Exxaro Resources (EXX) | Resources | 8.2% | 7.1 | 6.8% |
| 11 | Sirius Real Estate (SRE) | Property | 6.0% | 7.4 | 5.0% |
| 10 | Bid Corporation (BID) | Consumer | 2.8% | 17.0 | 1.2% |
| 10 | Stor-Age REIT (SSS) | Property | 7.2% | 6.9 | 0.9% |
What happened to these companies in 2020?
A streak built in calm years is cheap. South African earnings collapsed in 2020, and that is where these records were actually tested.
All 28 kept paying. Not one skipped a year.
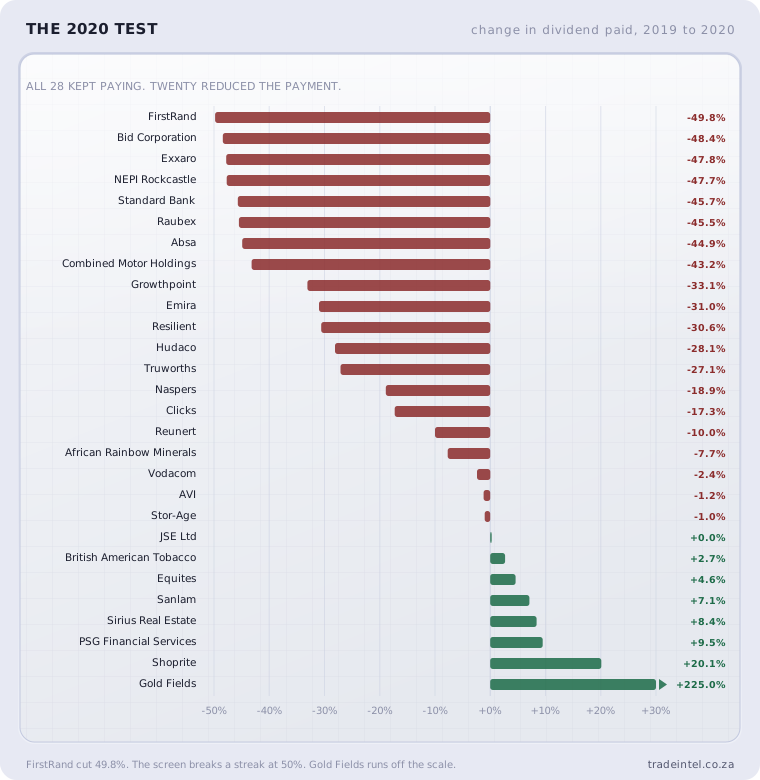
The amounts moved a long way, though. Twenty of the 28 reduced the payment, and eight cut it by more than 40%:
| Share | 2019 | 2020 | Change |
|---|---|---|---|
| FirstRand | 291c | 146c | -49.8% |
| Bid Corporation | 640c | 330c | -48.4% |
| Exxaro | 2,316c | 1,209c | -47.8% |
| NEPI Rockcastle | 864c | 452c | -47.7% |
| Standard Bank | 994c | 540c | -45.7% |
| Raubex | 44c | 24c | -45.5% |
| Absa | 1,125c | 620c | -44.9% |
| Combined Motor Holdings | 176c | 100c | -43.2% |
FirstRand went from 291 cents to 146 cents, a cut of 49.83%, against a rule that breaks a streak at 50%. It kept its place on this list by seventeen hundredths of a percentage point.
We are not going to pretend that is meaningful. A company that halves its dividend has halved its dividend, and a threshold that puts FirstRand on this list and would have removed it at 145 cents is an arbitrary line drawn by us. This is exactly why the list is published with the underlying numbers next to it rather than as a badge. If your own line is 30%, eight of these names fail it, and you now have what you need to draw that line yourself.
Eight companies raised or held the dividend through 2020. Gold Fields more than tripled it, from 80 cents to 260 cents, because the gold price ran while everything else fell. Shoprite paid 20% more. Sanlam, Sirius, Equites, PSG Financial Services and British American Tobacco all nudged theirs up, and JSE Ltd paid exactly what it paid the year before.
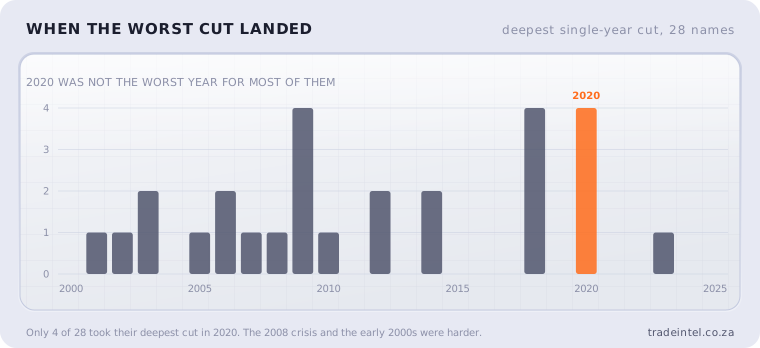
For most of these companies 2020 was not even the worst year. Only four of the 28 took their deepest cut then. The rest had a worse year earlier: African Rainbow Minerals cut 94% in 2007, Combined Motor Holdings 86% in 2008, Vodacom 74% in 2009, Reunert 68% in 2001. The 2008 financial crisis and the early 2000s were harder on JSE dividends than the pandemic was, at least for the companies still standing today.
Does a long streak mean a high yield?
No. A list like this gets read as an income list, and it is not one.
Naspers has paid every year for as long as our data runs and yields 0.7%. Truworths has the same streak length and yields 10.3%. They clear the same screen and they are nothing like the same investment.
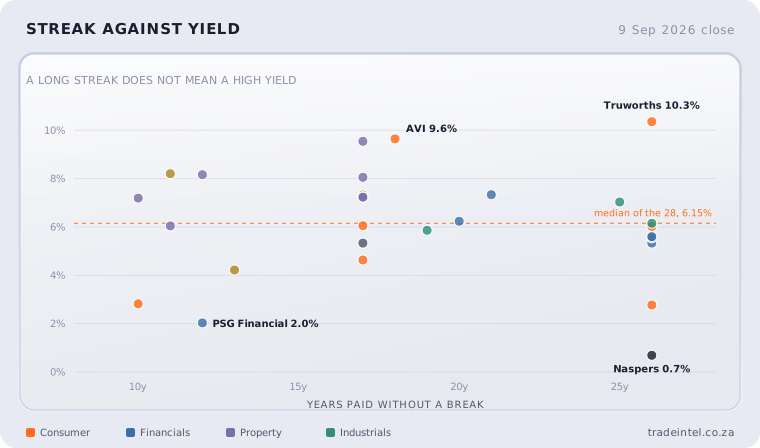
The 28 do skew higher than the market. Their median yield is 6.15% against 5.26% for the 105 JSE companies where we hold a yield, so consistency and income are correlated. They are not the same measurement. A streak tells you about the company's behaviour through a cycle. A yield tells you what the market currently charges for the payment, and a high one is sometimes the market saying it does not believe the payment will hold.
The FCF yield column is there for that reason. It is a rough check on whether the cash actually exists to fund the dividend. Emira at -7.2% and Resilient at -0.4% are paying out of something other than free cash flow this year, which is normal enough for property but worth knowing.
Why are property companies over-represented?
Seven of the 28 are property funds, which is a quarter of the list from a sector that makes up 14% of the JSE universe we screen.
That is not because property companies are unusually disciplined. South African REITs have to distribute the bulk of their taxable income to keep their REIT tax status. A property fund paying every year is partly a company being consistent and partly a company obeying tax law.
Read that column with the discount applied. The distribution is close to automatic, so the streak carries less information than the same streak at an industrial company that could have kept the cash and chose not to.
The same logic runs the other way for names like Hudaco, Reunert and Combined Motor Holdings. Nothing compels an industrial company to pay anything. Twenty-six years of paying anyway is a policy someone defended in a boardroom every year for twenty-six years.
What does this list not tell you?
Four limits, all of them ours rather than the companies'.
The longest streaks are open-ended. We pulled dividend history back to 2000, which is far more than the ten-year filter needs, so the eight names marked 26+ paid in every year we measured and almost certainly paid for years before that. Truworths and Standard Bank were both listed and paying well before 2000. We show 26+ rather than invent a number we did not measure.
Some of these streaks are just the company's whole life. JSE Ltd listed in 2006, Raubex in 2007, Equites in 2014, Stor-Age and Bid Corporation in 2016. They have never missed a payment, which is real, but they have also never been tested by a downturn before 2020. Truworths and Standard Bank have been through several.
A streak counts backwards to the last break. African Rainbow Minerals shows 17 years rather than 26+, because of that 94% cut in 2007. The clock restarted. The company is older than its streak.
None of this predicts next year. Every company on this page can cut tomorrow, and some of them will. A dividend record is a description of what management has done under pressure before, which is useful information and is not the same thing as a forecast.
How do you use this?
Twenty-eight names is where the work starts. This is the output of one filter on one day.
The screen gets more interesting when you stack it with something that tests whether the cash is real. Seven of these companies also clear our Cash Cows filter, which requires a free cash flow yield above 8% and positive free cash flow in each of the last three years: Absa, AVI, Combined Motor Holdings, Hudaco, JSE Ltd, Truworths and Vodacom. Those seven both earn the cash and hand it over, and we walked through how to build that stacked screen in The Dividend Kings That Are Also Cash Cows.
The filters used on this page are the Dividend Kings and Cash Cows screens, both described in full in The 10 Filters, Explained, along with the thresholds and the research behind each one.
Figures on this page come from the TradeIntel screener run of 9 September 2026 and from dividend payment histories going back to 2000. Yields, P/E and free cash flow yields move with price and are accurate as at that date.